
Every vehicle, every lot, on the clock.
We fly your site on the same mapping route at each observation time, day or night, and turn every flight into a dated map. Then we count every parked vehicle, lot by lot, so each number in your study traces back to imagery you can check.
FAA Part 107 · MBE / EDGE certified · Insured · Daytime and overnight thermal studies
Manual counts don't hold up
Clipboard tallies are labor-heavy, hard to verify and slow on large campuses.
The ARO Aerial method
Same route, same lot outlines, every observation, so results compare from one time to the next.
- A visual audit trail. Every count ties back to a zoomable map of the whole site at that moment.
- One snapshot per observation. A multi-acre campus is mapped in about 10 to 15 minutes, right at the scheduled time.
- No hidden or double-counted cars. An overhead map shows every stall once.
- Day or night. Thermal imaging counts parked vehicles after dark without lights or walking the lots.
- Engineering ready. Georeferenced maps and lot boundaries drop into Civil 3D, ArcGIS and your exhibits.
From flight to finished counts
Scope and lots
We confirm lot boundaries, the stall inventory and your observation times, plus any method your study must follow, then build one saved mission for the site.
Scheduled flights
A Part 107 pilot flies the same route at each observation, within 15 minutes of the target time, with airspace and campus coordination handled.
Maps and counts
Each flight becomes a map. We count every vehicle from it, assign each one to its lot and recheck before anything is reported.
Report and data
You get an Excel dataset, a branded PDF report, the maps and lot boundaries, ready for your study or exhibit.
Two ways to count, depending on when demand peaks
Most studies are daytime. Residential and 24-hour sites often need the overnight number, when residents are home and visitors are gone.
Daytime observations
High-resolution color mapping at each scheduled time, typically several observations a day across representative weekdays. Best for hospitals, campuses, retail, offices and traffic impact studies.
Overnight thermal
After dark, parked cars read differently from the pavement around them in thermal imaging, so we can count them with no lights and no one walking the lots. Best for apartments, multifamily portfolios and overnight demand.
Each property was flown with thermal on separate nights and counted from the thermal maps, with a second pass on the largest properties. Counts were within about ±2 vehicles at small properties and ±3 to 5 at the largest. Thermal maps are built for counting, not for measurement.
Hospital campus · Mansfield, Ohio
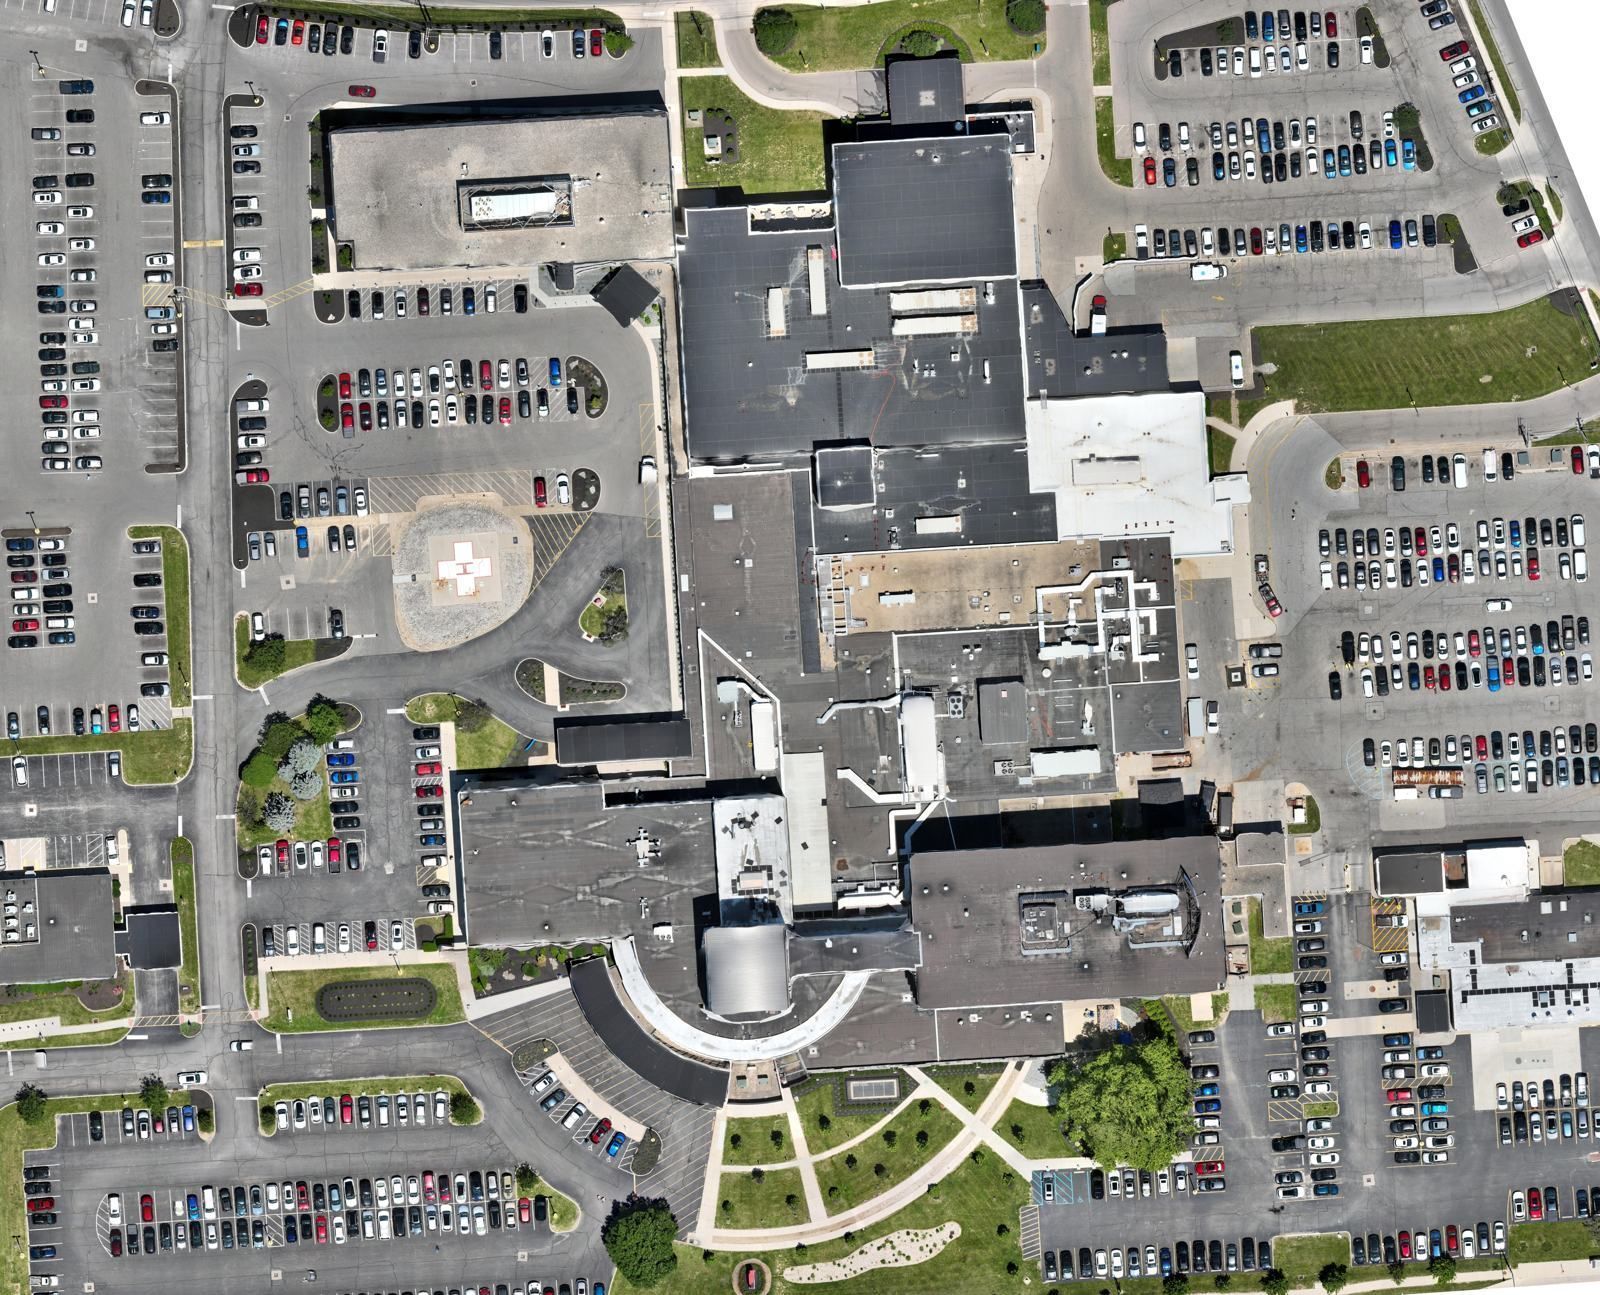
Three observations a day (10 AM, 12 PM and 2 PM) over six weekdays, covering 15 surface lots on all four sides of the hospital: 18 maps and 19,377 vehicle counts.
Every lot gets its own peak, low and average, and occupancy is calculated against the stall inventory.
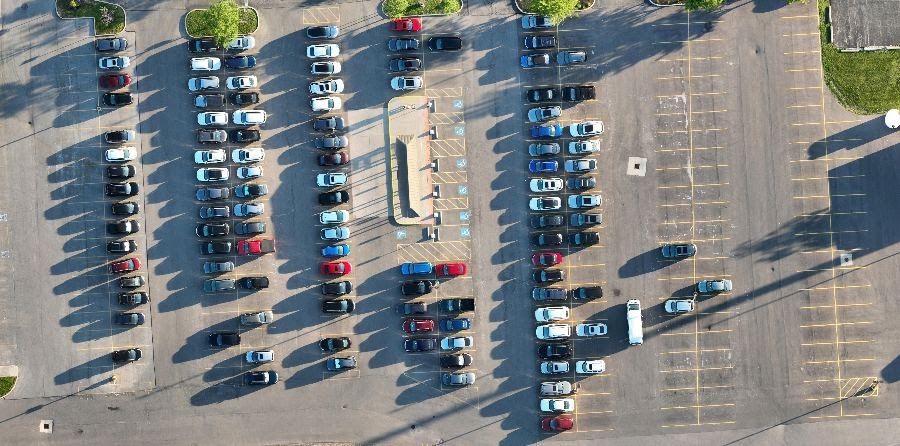
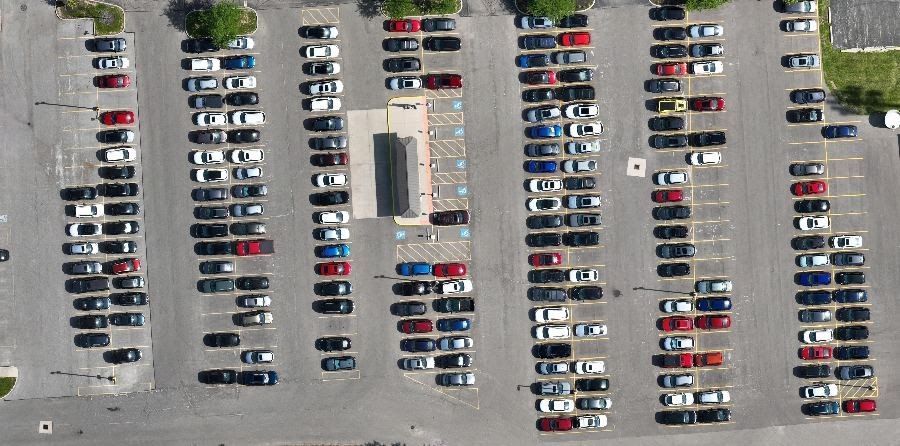
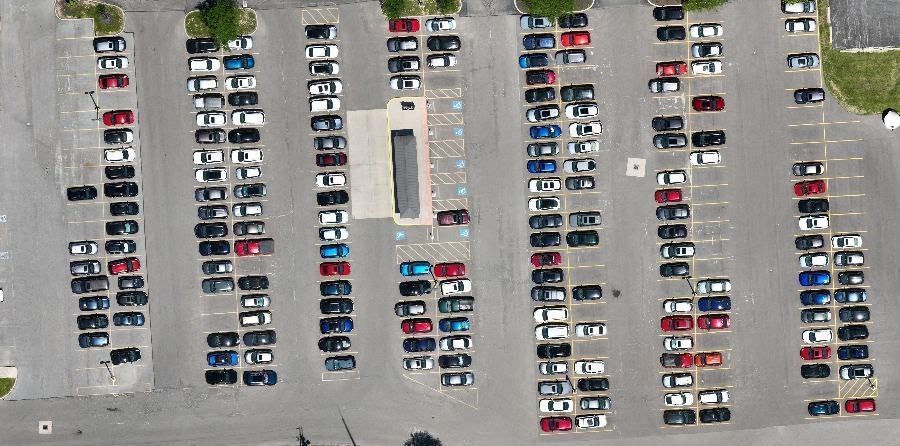
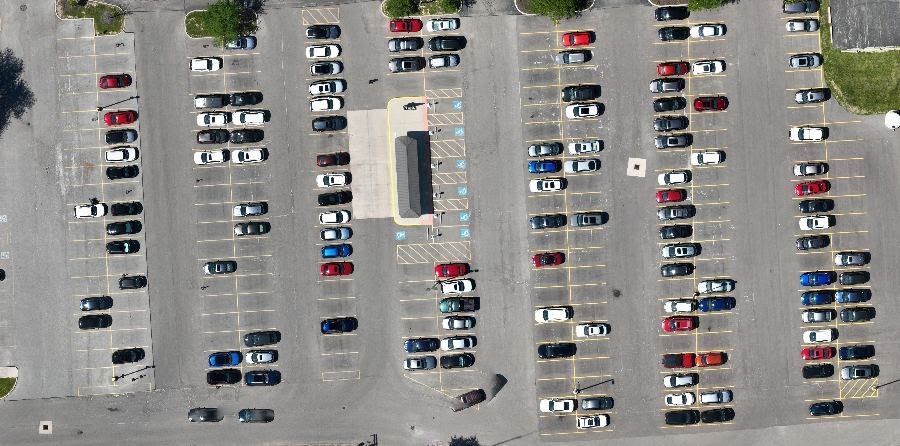
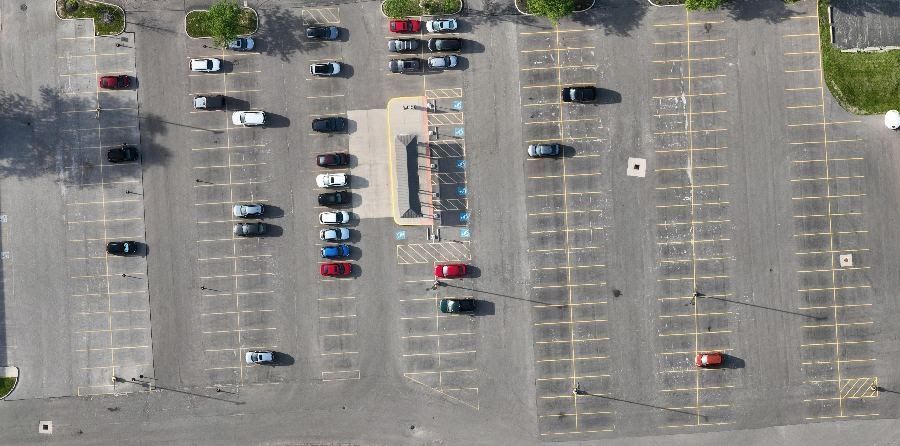
Same lot, five flights
A Columbus hospital's shuttle lot on one study day, cropped to the same frame from five separate flights.
What you receive
| Deliverable | Format |
|---|---|
| Vehicle counts by lot and observation, with occupancy % | Excel / CSV |
| Summary report with charts, maps and findings | |
| A map for every observation | GeoTIFF / JPG |
| Lot boundaries | KML |
| Stall inventory, if you don't have one | Digitized from the daytime map |
Built for
A better record for a similar budget
Most parking studies are priced against a ground count crew. Ours land in the same range and leave you with a permanent visual record.
| Traditional ground count | ARO Aerial study | |
|---|---|---|
| What you get | Tally sheets typed into a spreadsheet | Excel dataset, PDF report, a map for every observation and lot boundaries |
| Proof behind each number | The count is whatever the counter wrote down | A dated map for every observation; any count can be checked or rerun |
| Snapshot timing | 30 to 60 minute sweeps, so lots are counted at different times | The whole site in one 10 to 15 minute flight |
| Overnight counts | Flashlights and staff in residents' lots | Thermal flights from a single launch point |
| Next study | Starts from scratch | Same flight plan and lot outlines, so results compare over time |
| Field risk | Staff walking traffic aisles for 10 to 12 hours | One pilot at a safe launch point |
One fixed fee, quoted before we fly
Every study is quoted as a fixed fee in a written scope. Send the site and schedule and you'll have a number within one business day.
What sets the price
- Number of capture days or nights
- Observations per day
- Number and size of lots
- Daytime or overnight thermal
Included
- Airspace authorization and campus coordination
- Counts, report, maps and lot boundaries
- Weather reschedules at no charge
- Travel within 50 miles of Columbus
Add-ons
- Stall inventory digitizing
- Turnover and recent-arrival analysis
- Program rates for repeat studies and portfolios
Parking study FAQ
How accurate is a drone parking count?
Daytime counts come from a high-resolution map of the whole site, so every vehicle is visible and checked a second time before reporting. Overnight thermal counts carry a stated tolerance, typically ±2 vehicles at small properties and ±3 to 5 at large ones. Either way, the map behind each count is delivered so a reviewer can check it.
Can you follow our required study method?
Yes. Tell us the observation days, times and any method your engineer or city requires, and we build the flight schedule around it.
Do we need a stall count first?
Occupancy needs a stall inventory. If you don't have a current one, we can digitize stalls from the first daytime map as a priced add-on.
Will the flights disturb patients or residents?
Flights are short, high and routed over the lots. For night work we notify property management in advance and fly from a single launch point.
Is a drone map a survey?
No. Parking maps are for counting and planning. Thermal maps in particular are built for counting, not measurement.
Planning a parking study?
Send the site, a lot exhibit and your observation schedule. We'll return a fixed-fee scope within one business day.